Entrepreneur and Business Resources
Integral Methods and Technology
Governance and Investor Responsibility
|
Portfolio Performance June 2004
Current Investments
Listed opportunities are initially screened from one of the SRI indicies, including DJSI, FTSE4Good, for further consideration. The working list is here and the portfolio here.
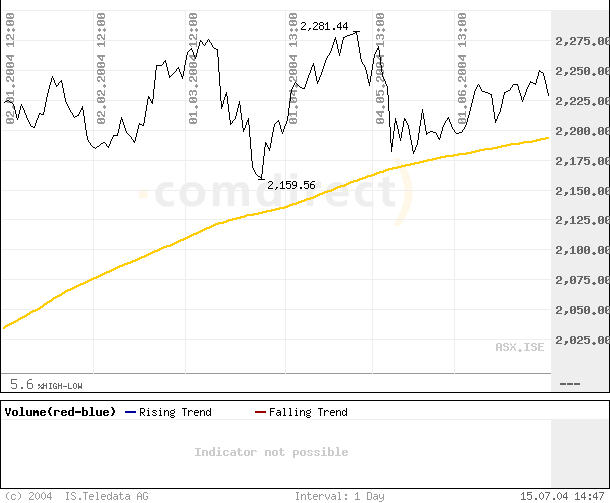
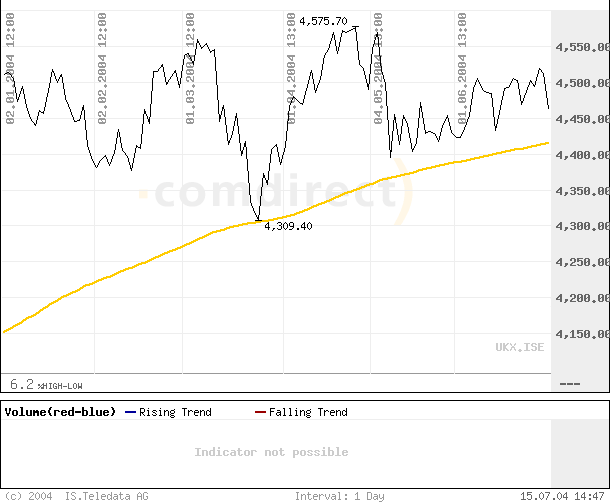
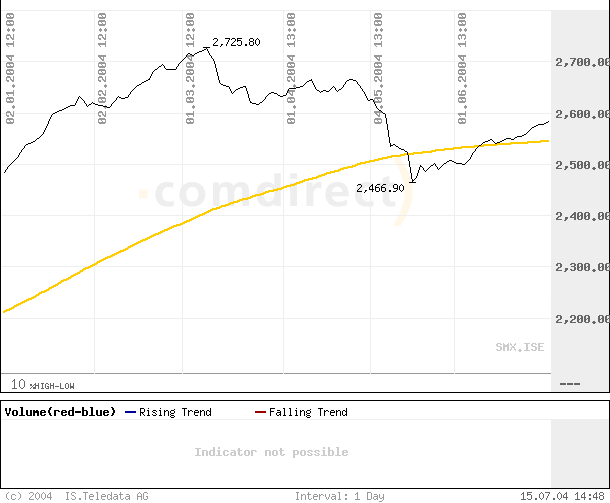
The portfolio has matched the market to date, depreciating by approximately 3%. Ironically, if the two non-green companies are excluded from the portfolio it would have exceeded performance achieving a 4% appreciation in 5 months.
The following charts show market movements during the comparison period.
FTSE All Share January to June 2004
FTSE 100 January to June 2004
FTSE Small Cap January to June 2004
Current Investments * GRI
Model Portfolio 2001 * Test Portfolio 1999
- 2001
Model Portfolio
2001
In March 2001 as part of the early development
of the GRI strategy a model portfolio was analysed. The
report from then is here in sxw format. The summary is as
follows:
March 2001
The Fund
Performance Benchmarking
Although globally responsible investment is an emerging phenomenon full of potential, an indication that superior returns may be justified is obtained by reviewing performance of listed vehicles. Suitable targets demonstrate globally responsible initiative in product or business management and in many cases are targets of socially responsible funds (either green or ethical).
Presented here is a summary review of nine listed companies to demonstrate that:
-
There are commercial industrial opportunities available which may be acquired in public markets.
-
Performance may be superior.
No private companies are reviewed here because information is less readily available and may be confidential.
No proposed investment portfolio structure or investment timing is advocated because no investment has been made by The Fund yet. However, some of the companies may be appropriate investments for the Fund now or in the future.
-
Summary
| Name |
Business |
3 year Sales CAGR |
3 year EPS CAGR |
2 year Stock Price CAGR E* |
Relative to Index |
| Astropower |
Solar electric power products |
44% |
37% |
137% |
Above |
| Ballard Power Systems |
Proton exchange membrane power cells |
45% |
NA |
10% |
Above |
| GaiaM |
LOHAS goods and services |
46% |
65% |
60% (1.5yrs) |
Above |
| Horizon Organic Dairy |
Organic dairy products |
63% |
NA |
-26% |
Below |
| Ionics |
Water purification and treatment |
10% |
NA |
-9% |
Below |
| Odwalla |
Natural super premium beverages |
21% |
NA |
22% |
Above |
| Plug Power |
PEM power cells for on site generation. |
91% |
NA |
0% |
Above |
| Whole Foods Market |
Natural food supermarkets. |
18% |
0% |
22% |
Above |
| Wild Oats Markets |
Natural food supermarkets |
34% |
NA |
-20% |
Below |
*Estimated
Current Investments
* GRI Model Portfolio 2001 * Test
Portfolio 1999 - 2001
Test Portfolio 1999-2001
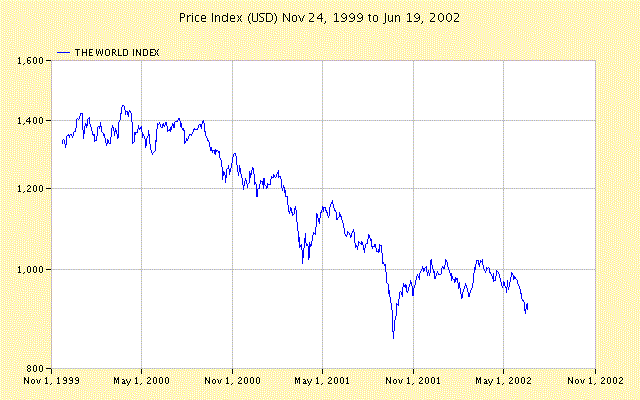
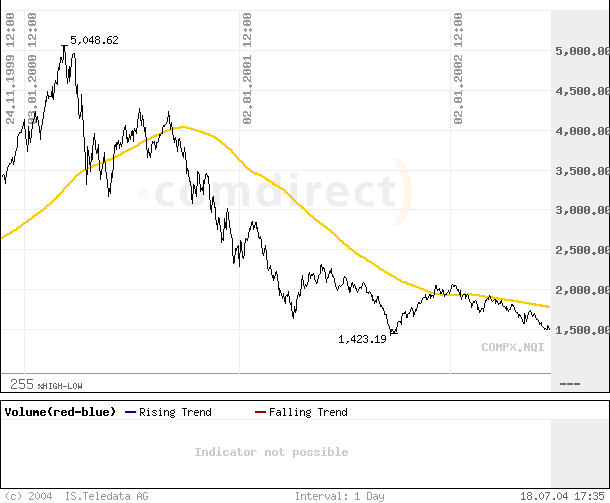
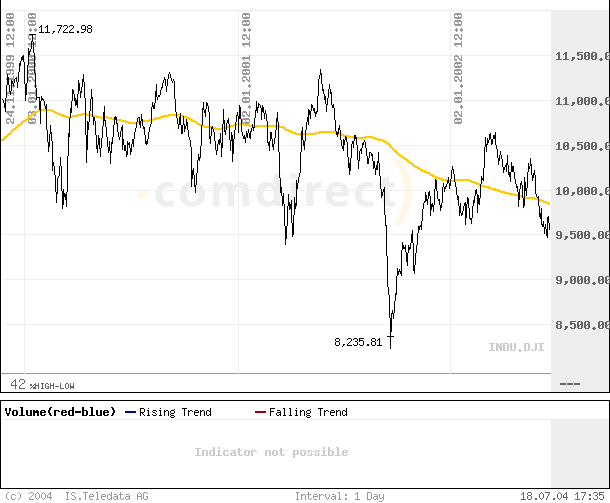
A portfolio experiment was run by Astraea from the end of 1999 to the end of 2001 to learn and test the dynamics of online trading.
That portfolio had a net return of approximately -25% per annum, which
matched the markets in which it was active (see charts below). The strategy
was not particular and generally picked a handful of interesting companies
which were held for short and long terms. (There was no particular green
strategy, except a conscious decision not to sell and short sell was made
at 8.54am 11 September 2001.)
Details are in the spreadsheet here.
NASDAQ November 1999 to June 2002
DJIA November 1999 to June 2002
MSCI World November 1999 to June 2002
